User Research
User Interviews
Usability Testing
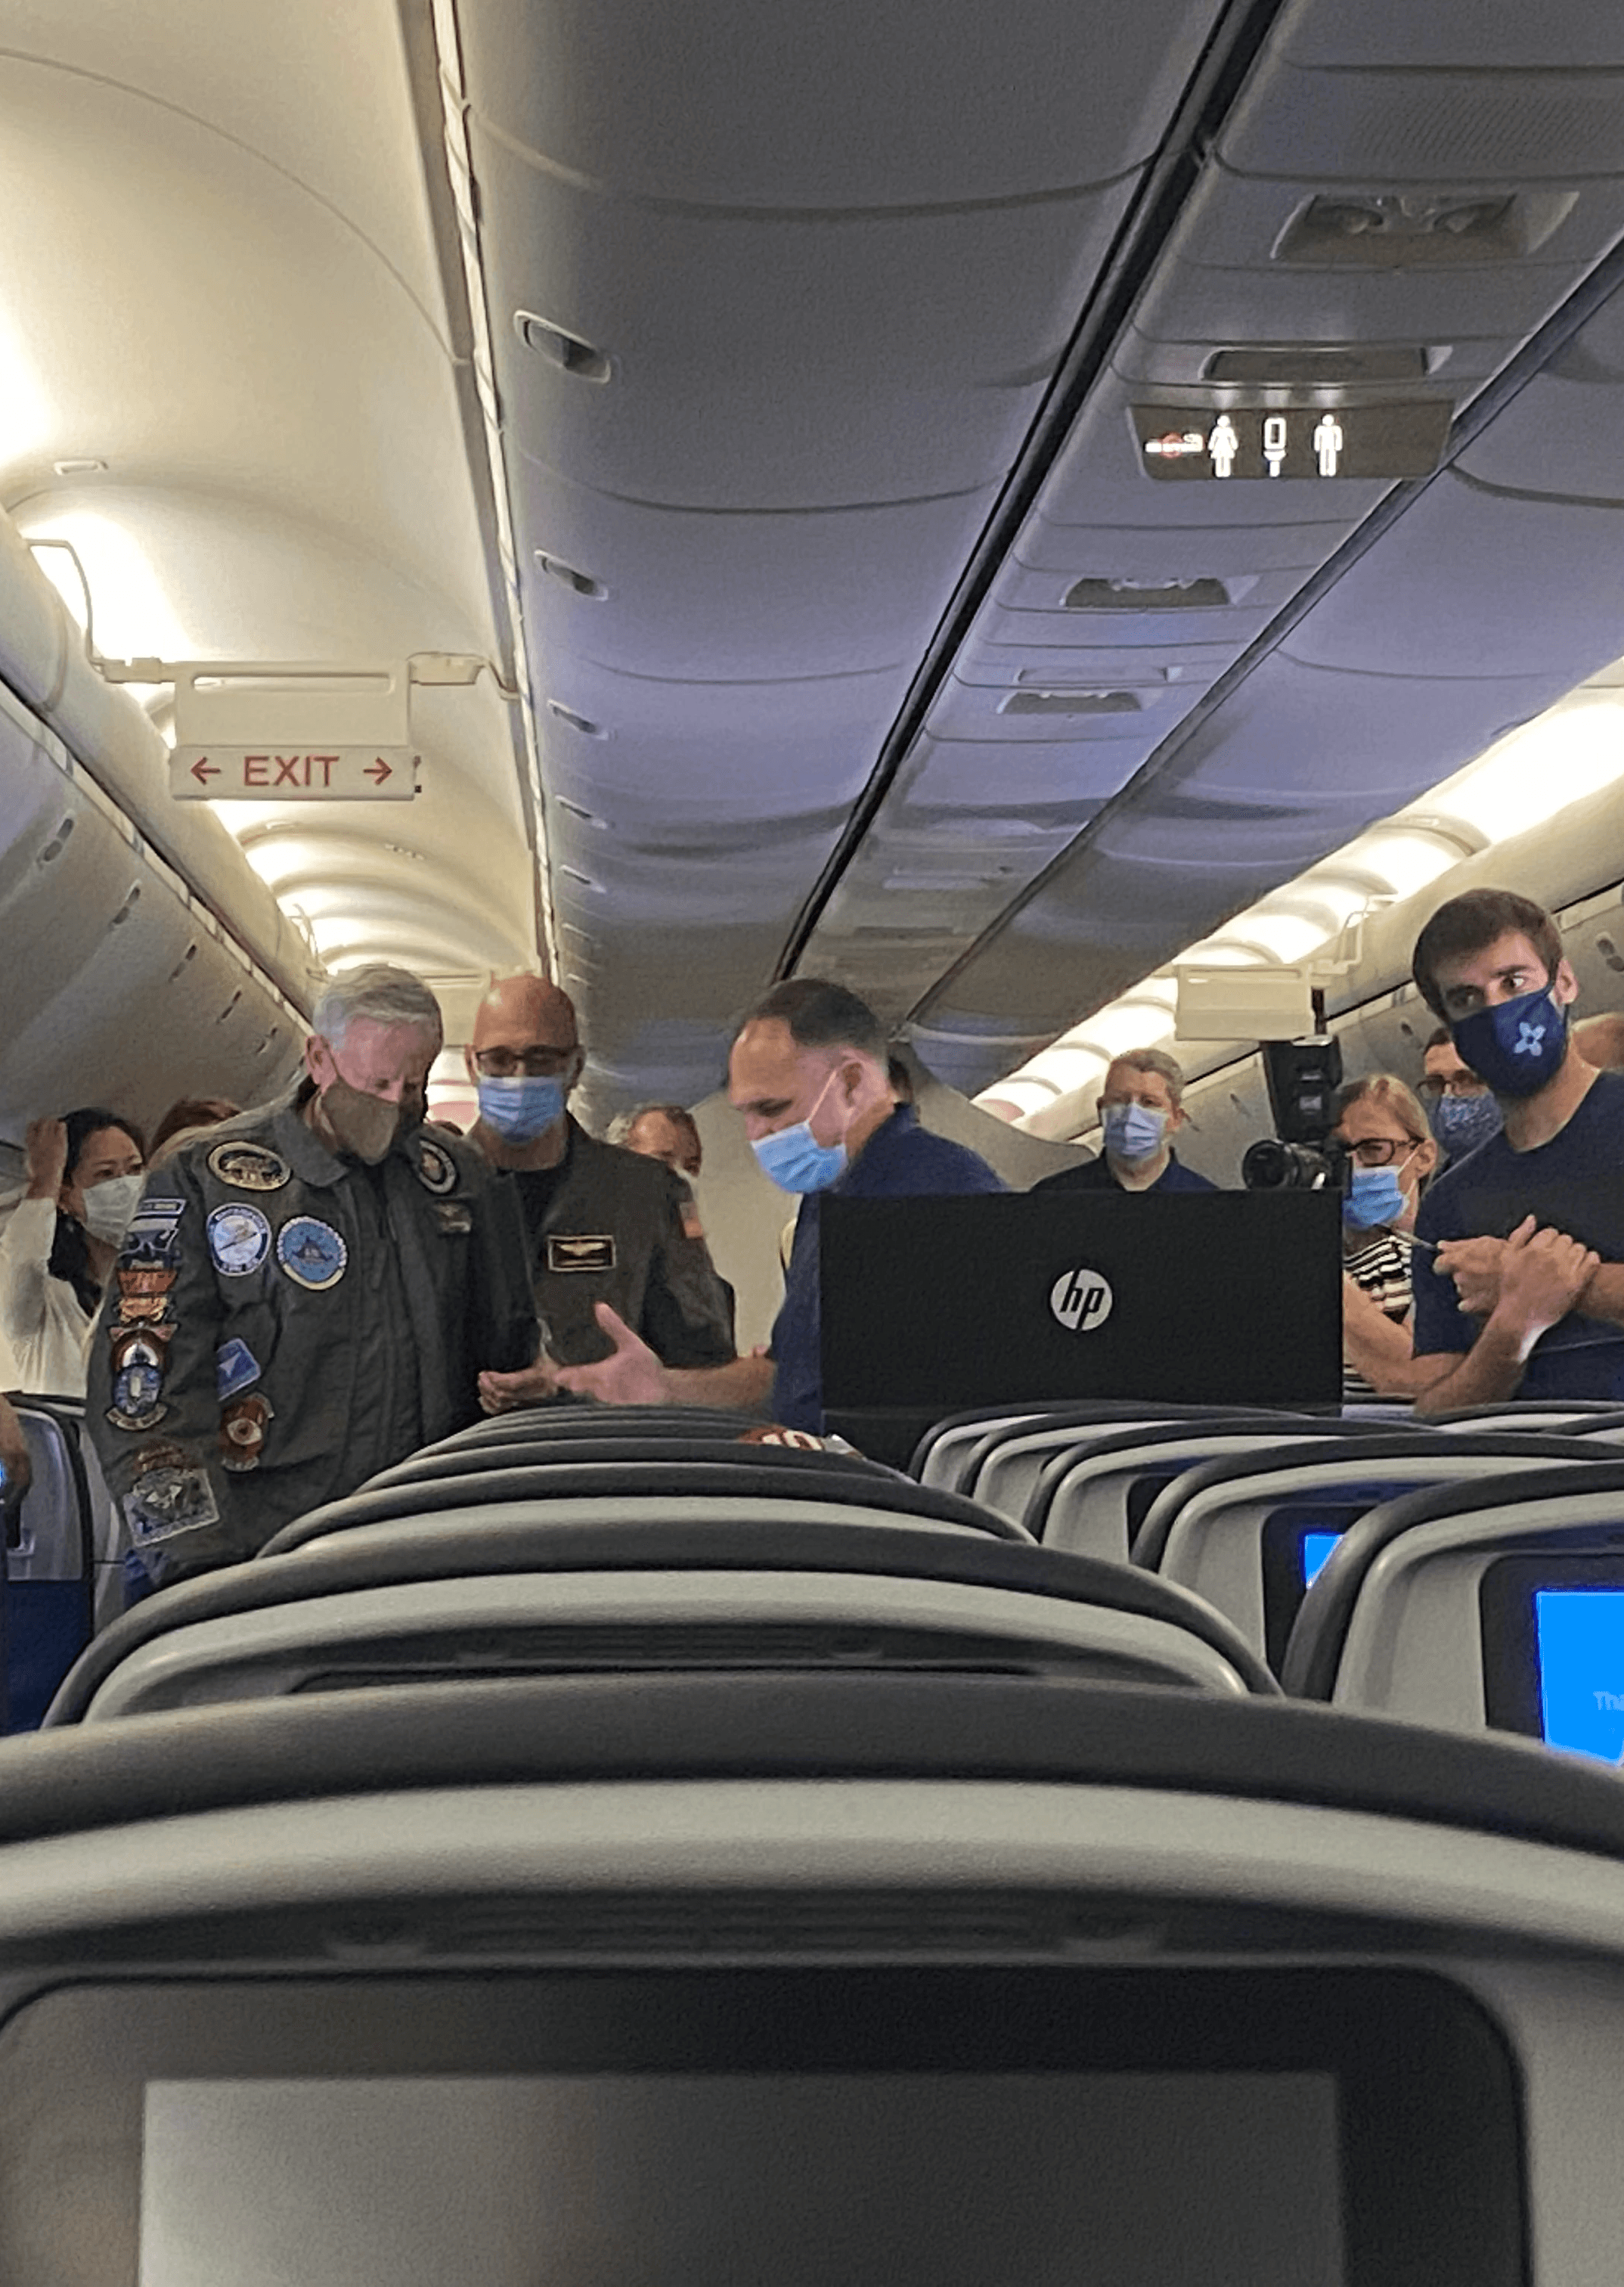
The positive outcome of United Airlines and S3i's project, viewed by 1.4 million people!

Due to confidentiality agreements with S3i, the Department of Defense and United Airlines, I am unable to share detailed visuals or specifics of the interface publicly. However, results of this project are public (as shown above) and I am able to discuss my design approach in further detail during interviews.
Project Overview
Company: S3i in partnership with the U.S. Department of Defense and United Airlines
Role: UX Researcher and Usability Testing Moderator
Duration: 8 Days
Methods: Moderated usability testing, qualitative data analysis, rapid prototyping
Objective: To identify and address usability issues in the IBAC interface for real-time, in-flight Covid-19 aerosol detection.
Problem Statement
As air travel continued during the Covid-19 pandemic, assessing airborne risks became essential to passenger and crew safety. S3i’s aerosol detection sensors offered a promising solution for in-flight detection, but the existing user interface presented challenges in usability for real-time monitoring. This project aimed to evaluate and enhance the usability of the S3i sensor interface, enabling pilots to effectively monitor aerosol data during flight operations.
Challenge
Pilots require immediate comprehension and swift decision-making abilities when interpreting data in high-stress environments. The interface needed to minimize cognitive load and eliminate any ambiguous elements. Usability testing was crucial to ensure that the interface could reliably communicate potential risks without overwhelming the pilot.
Exploration and Discovery
Initial Research & Preparations
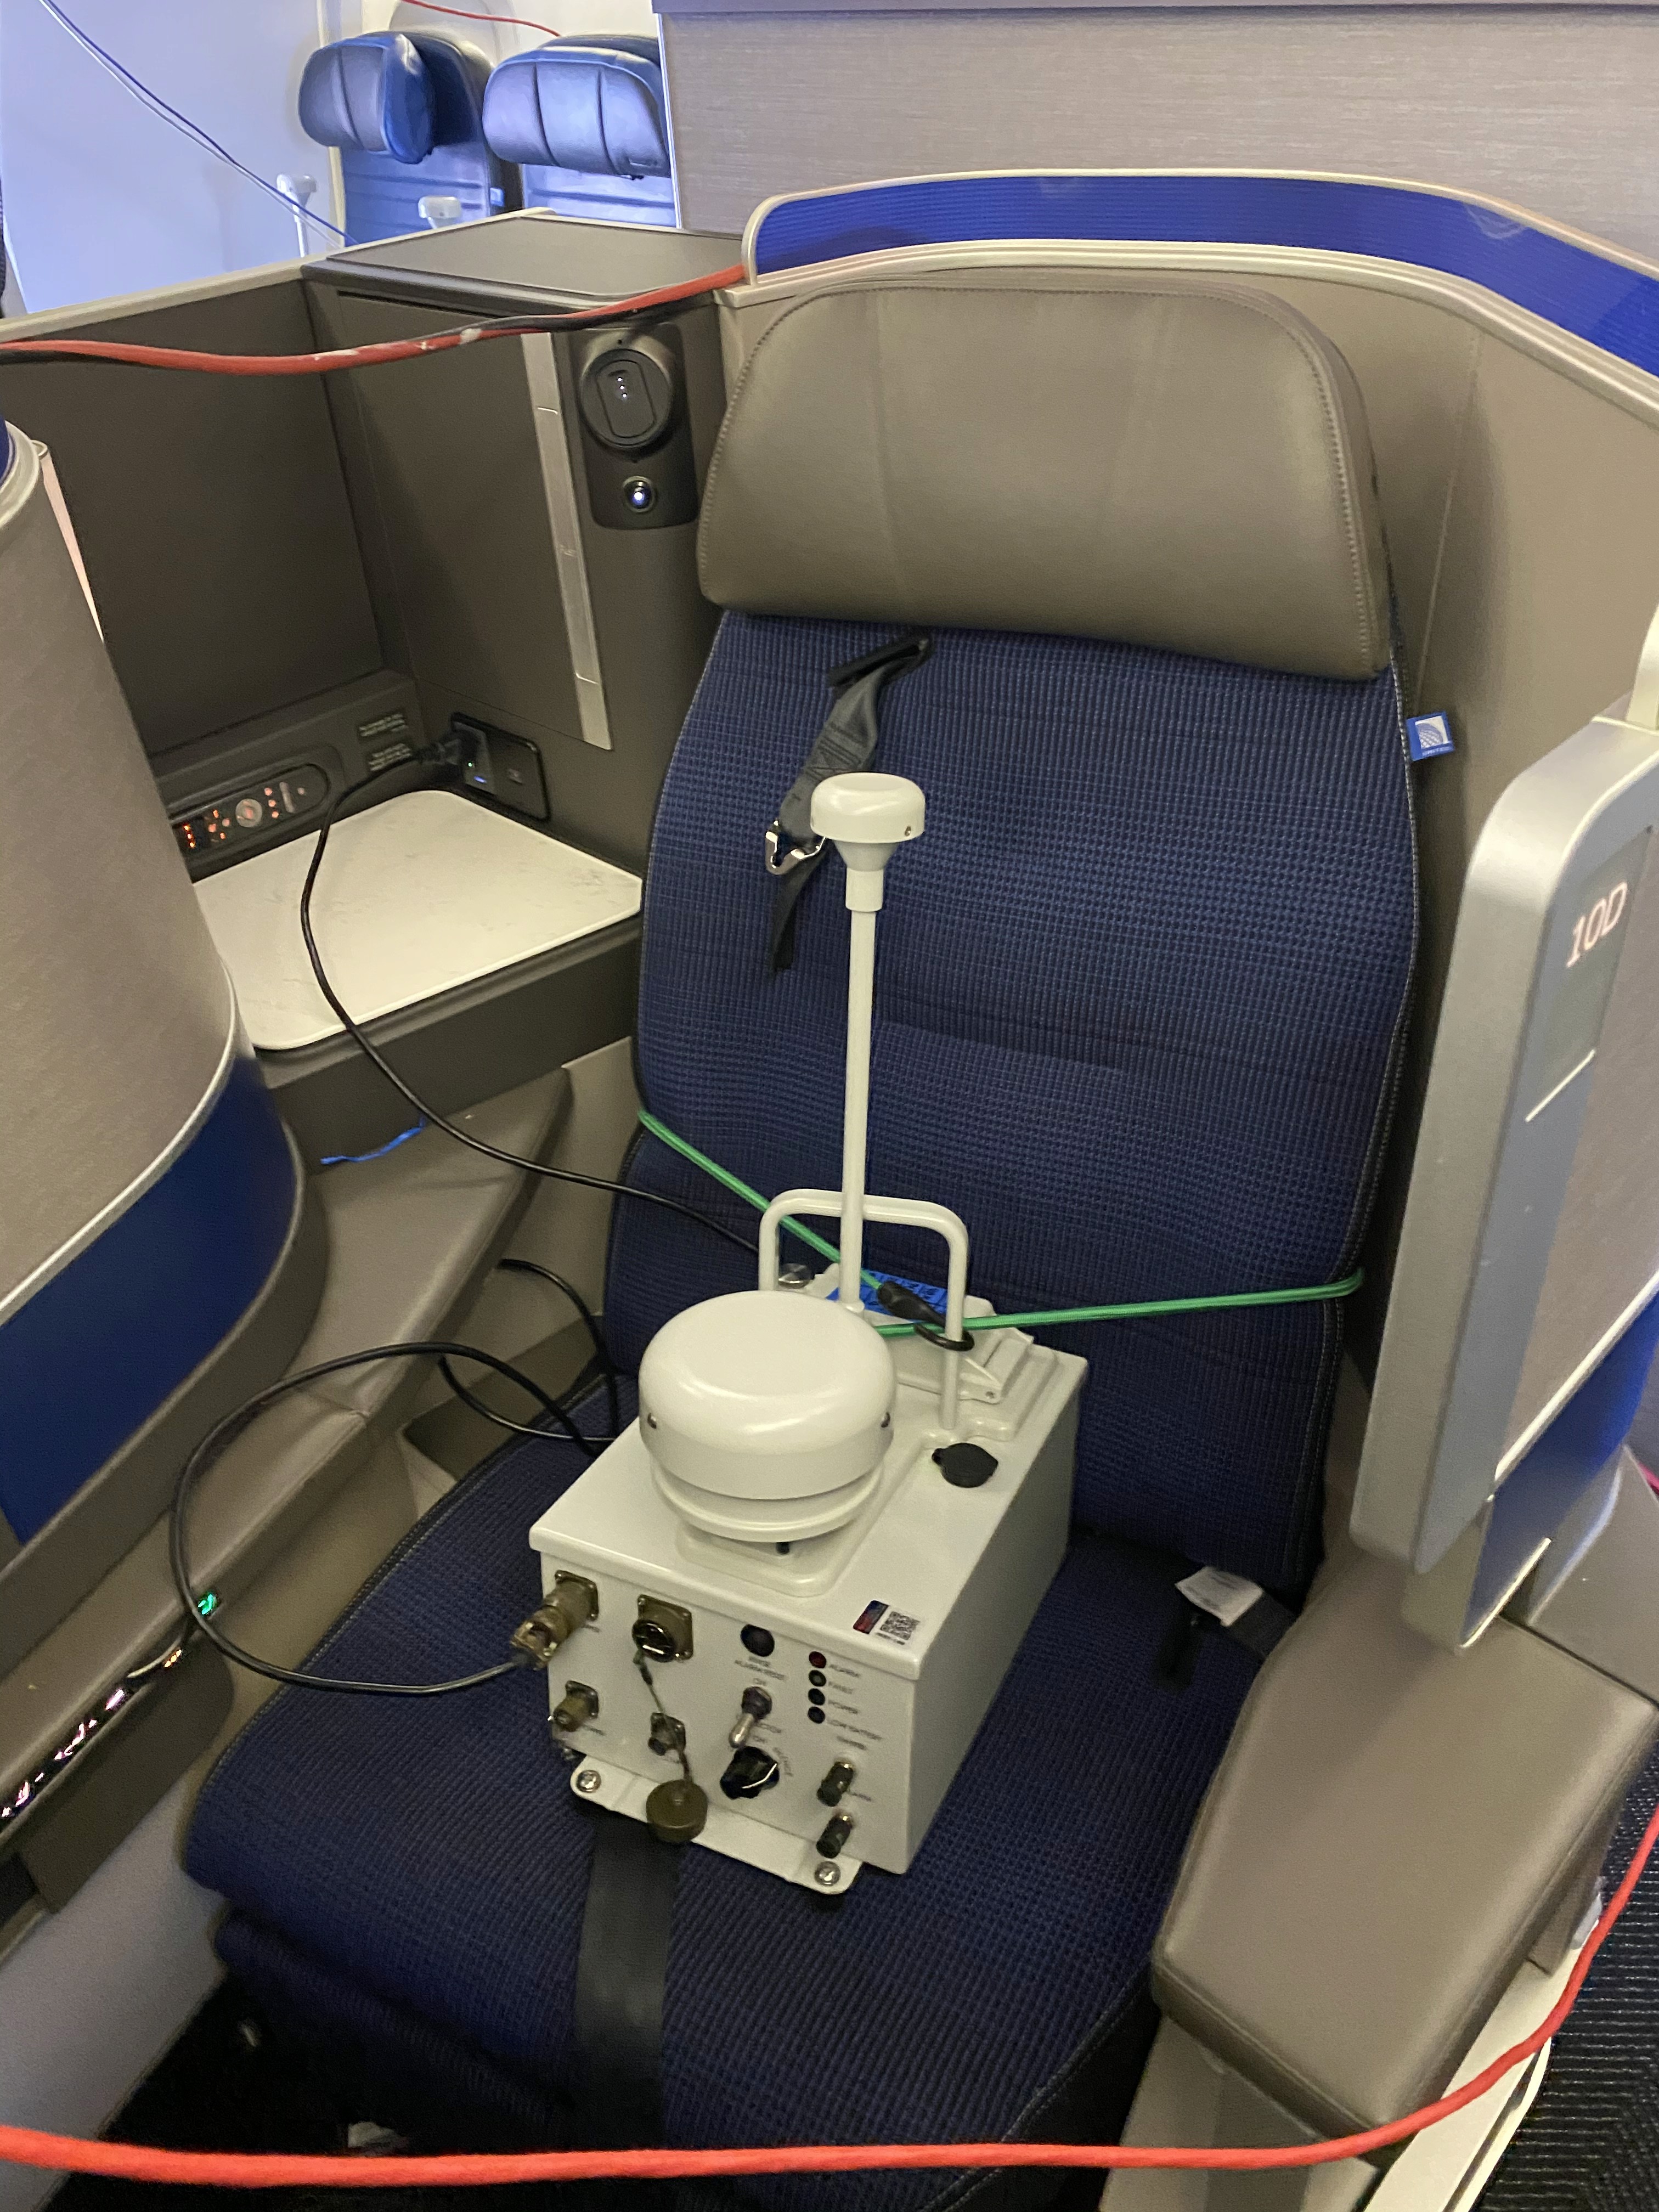
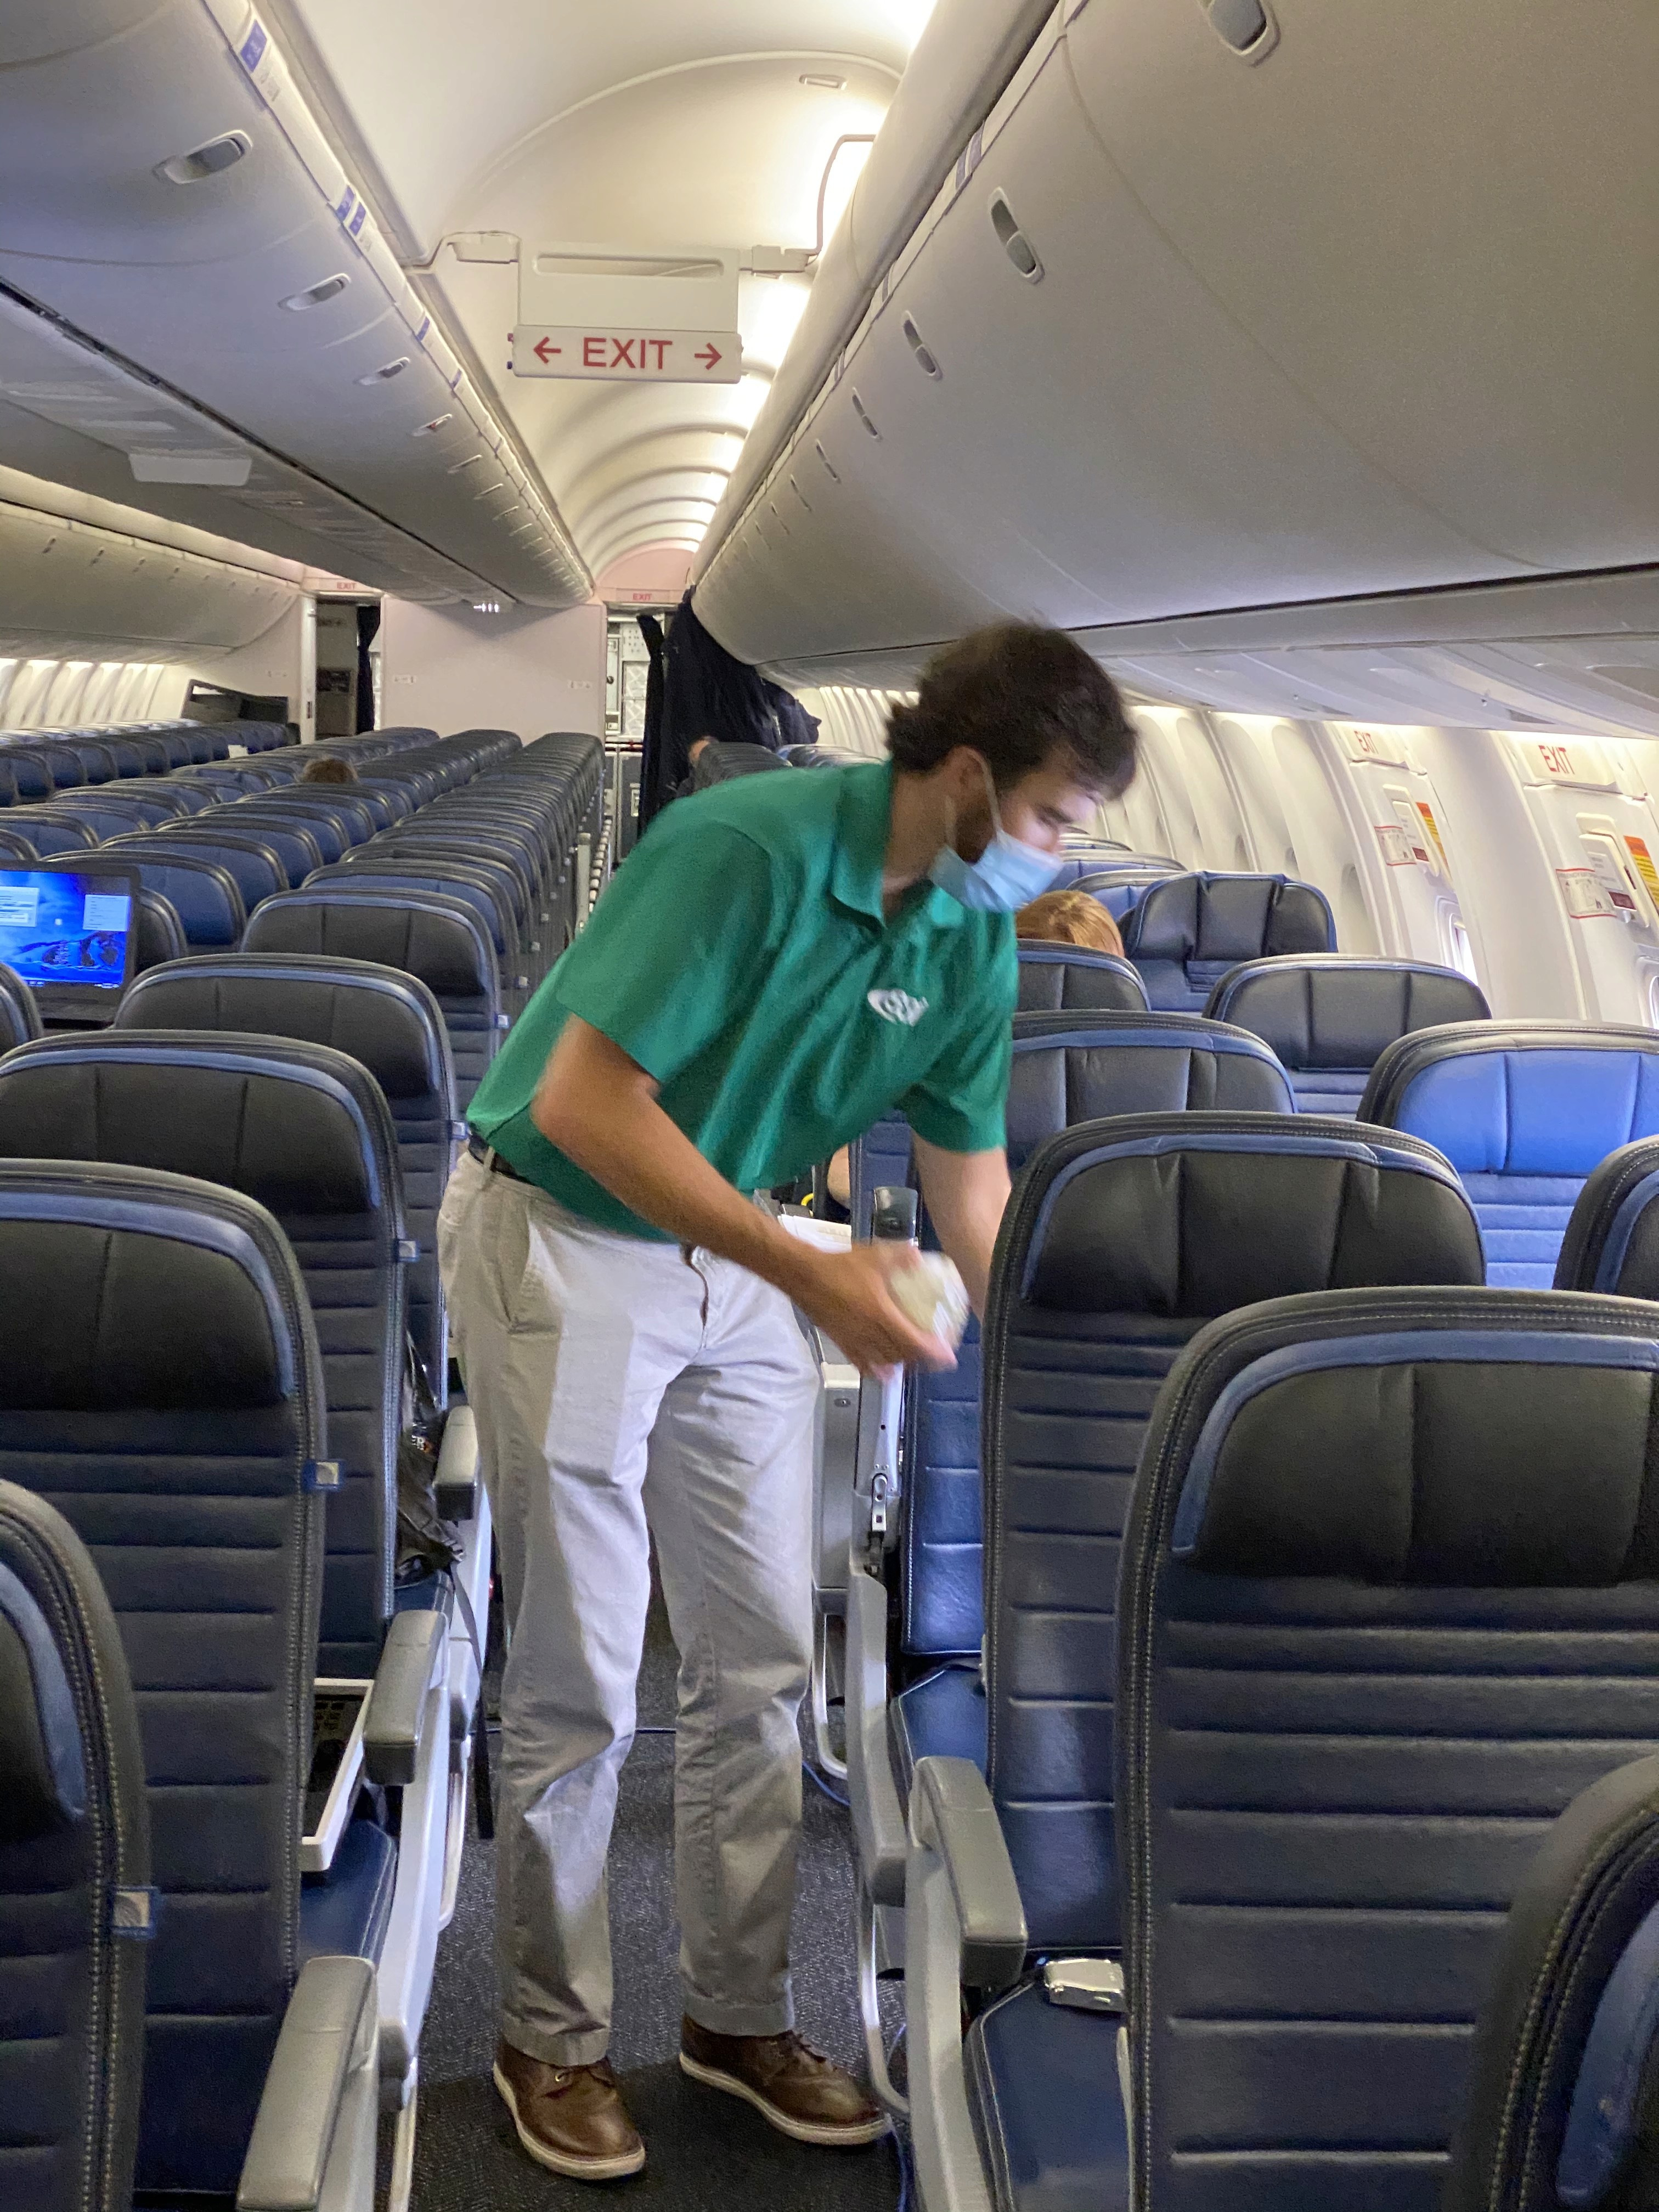
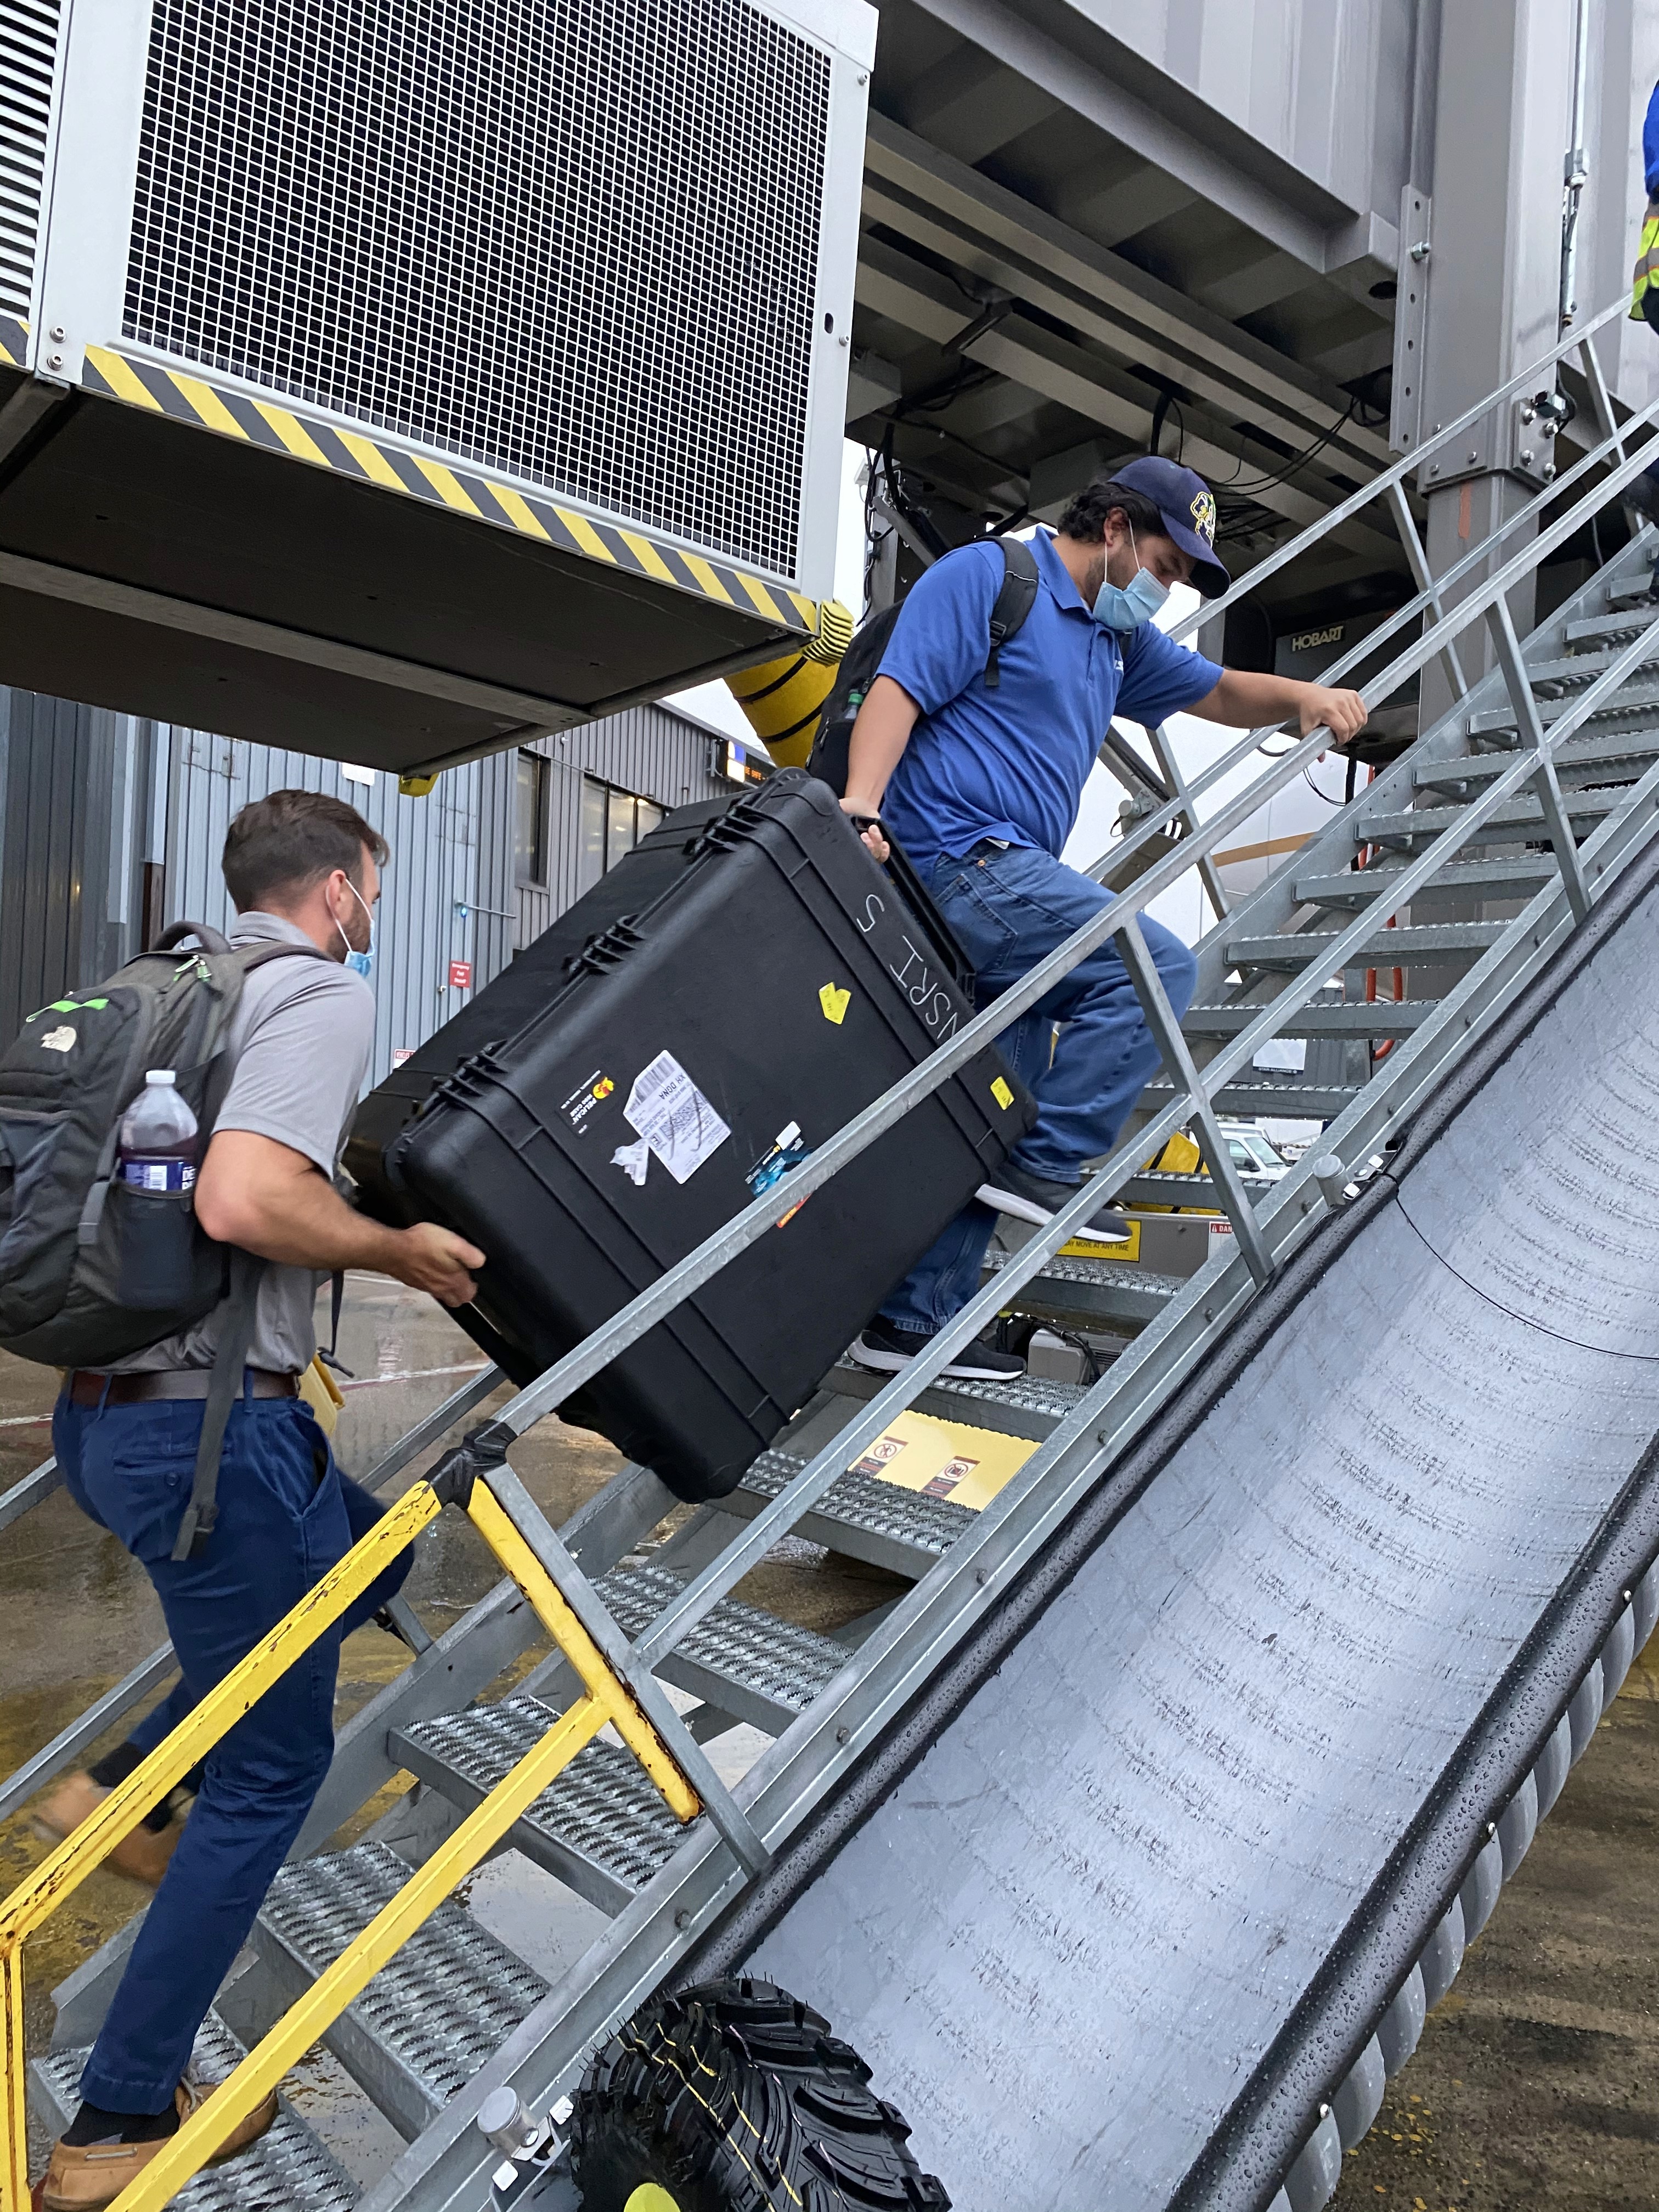
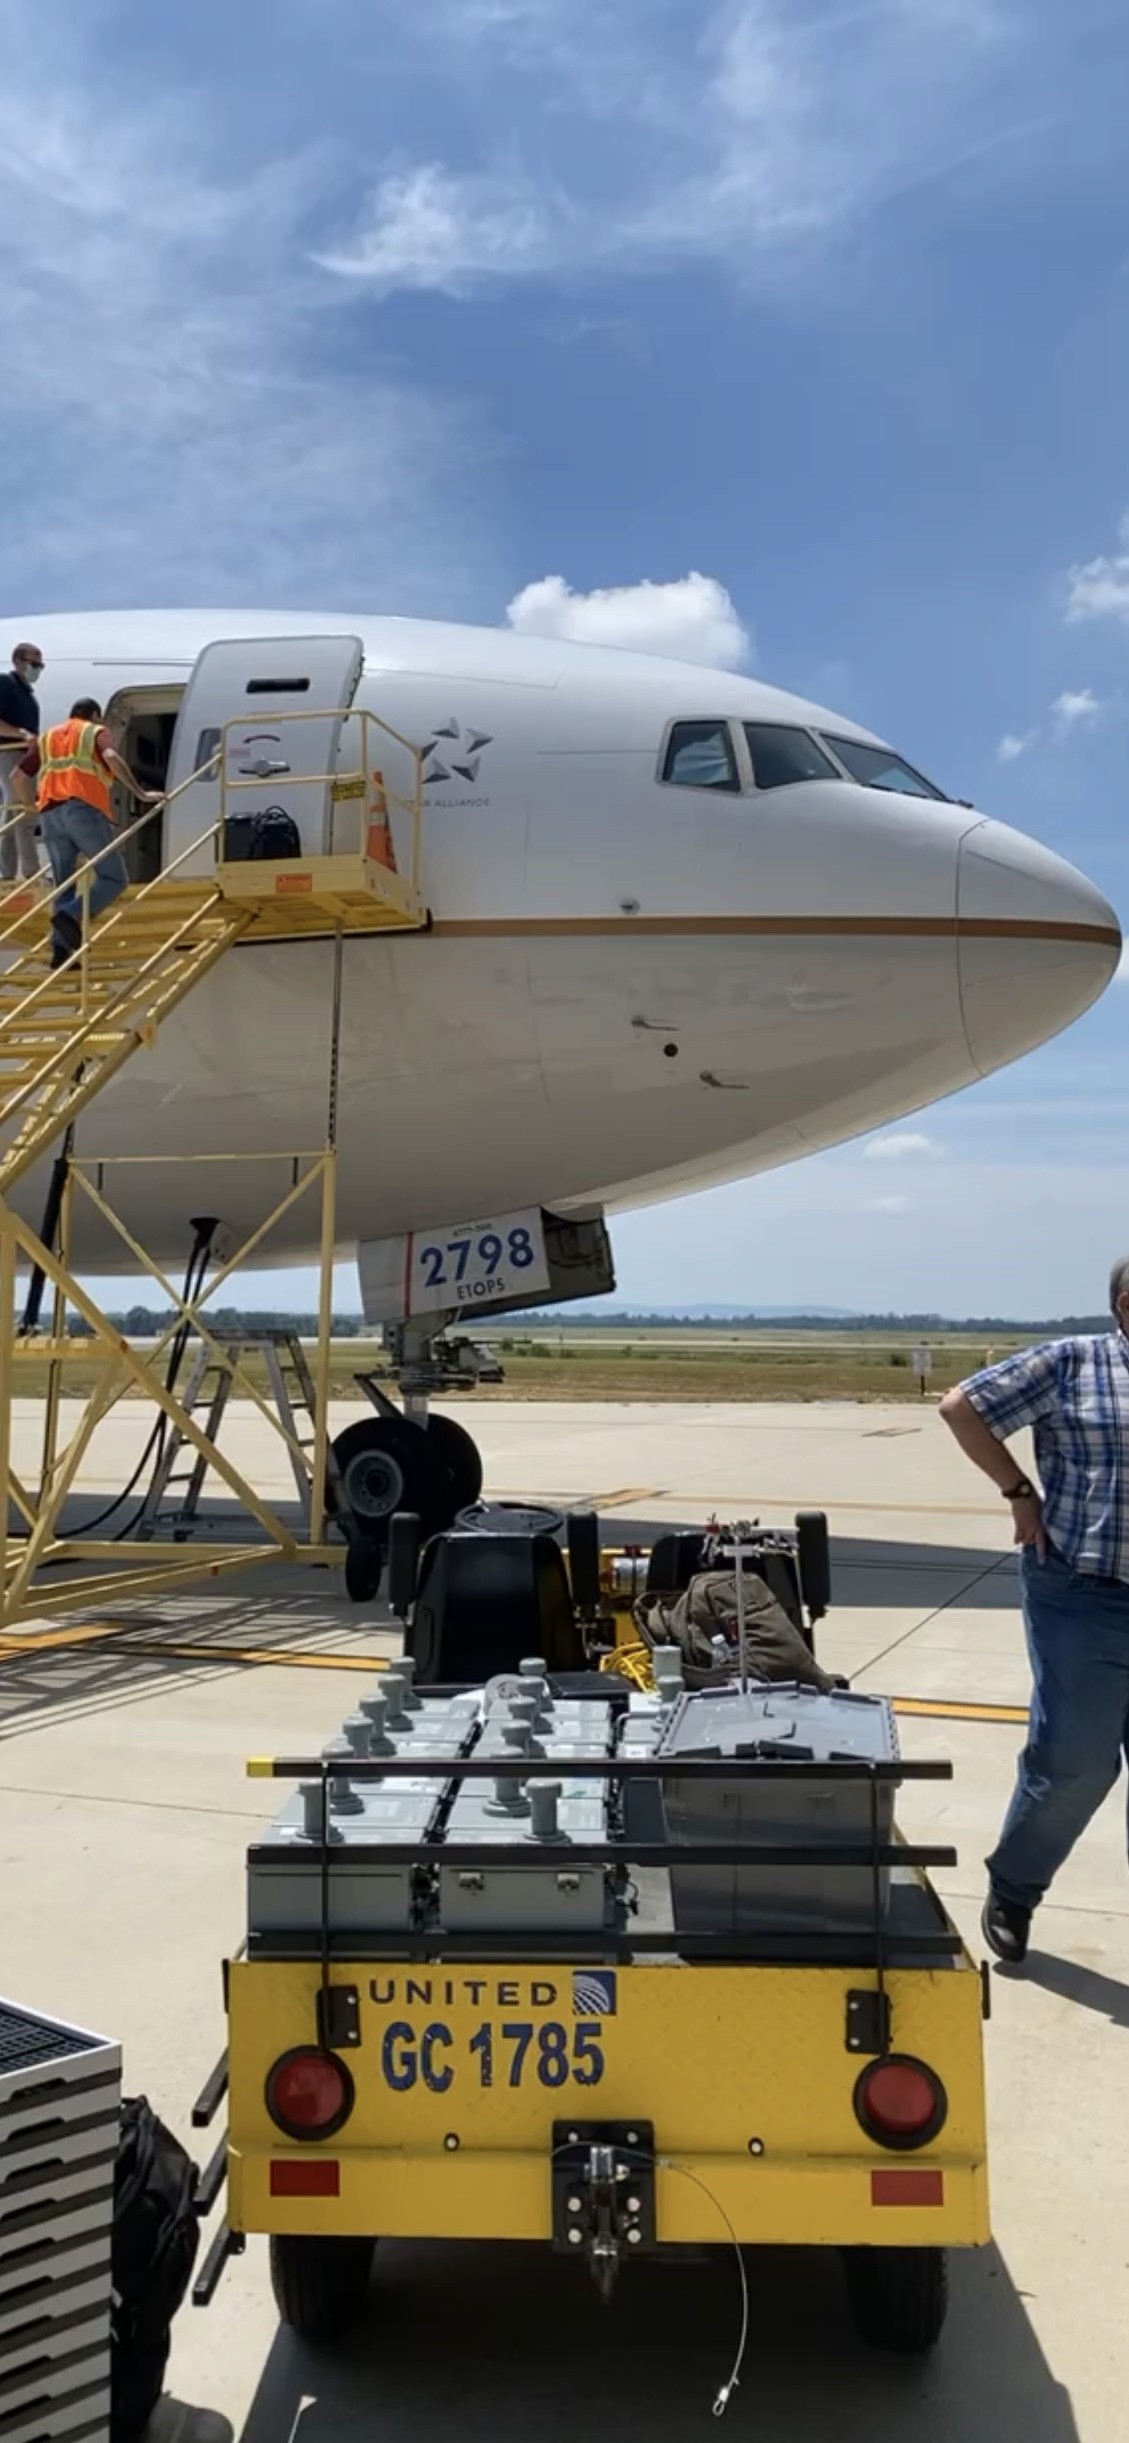
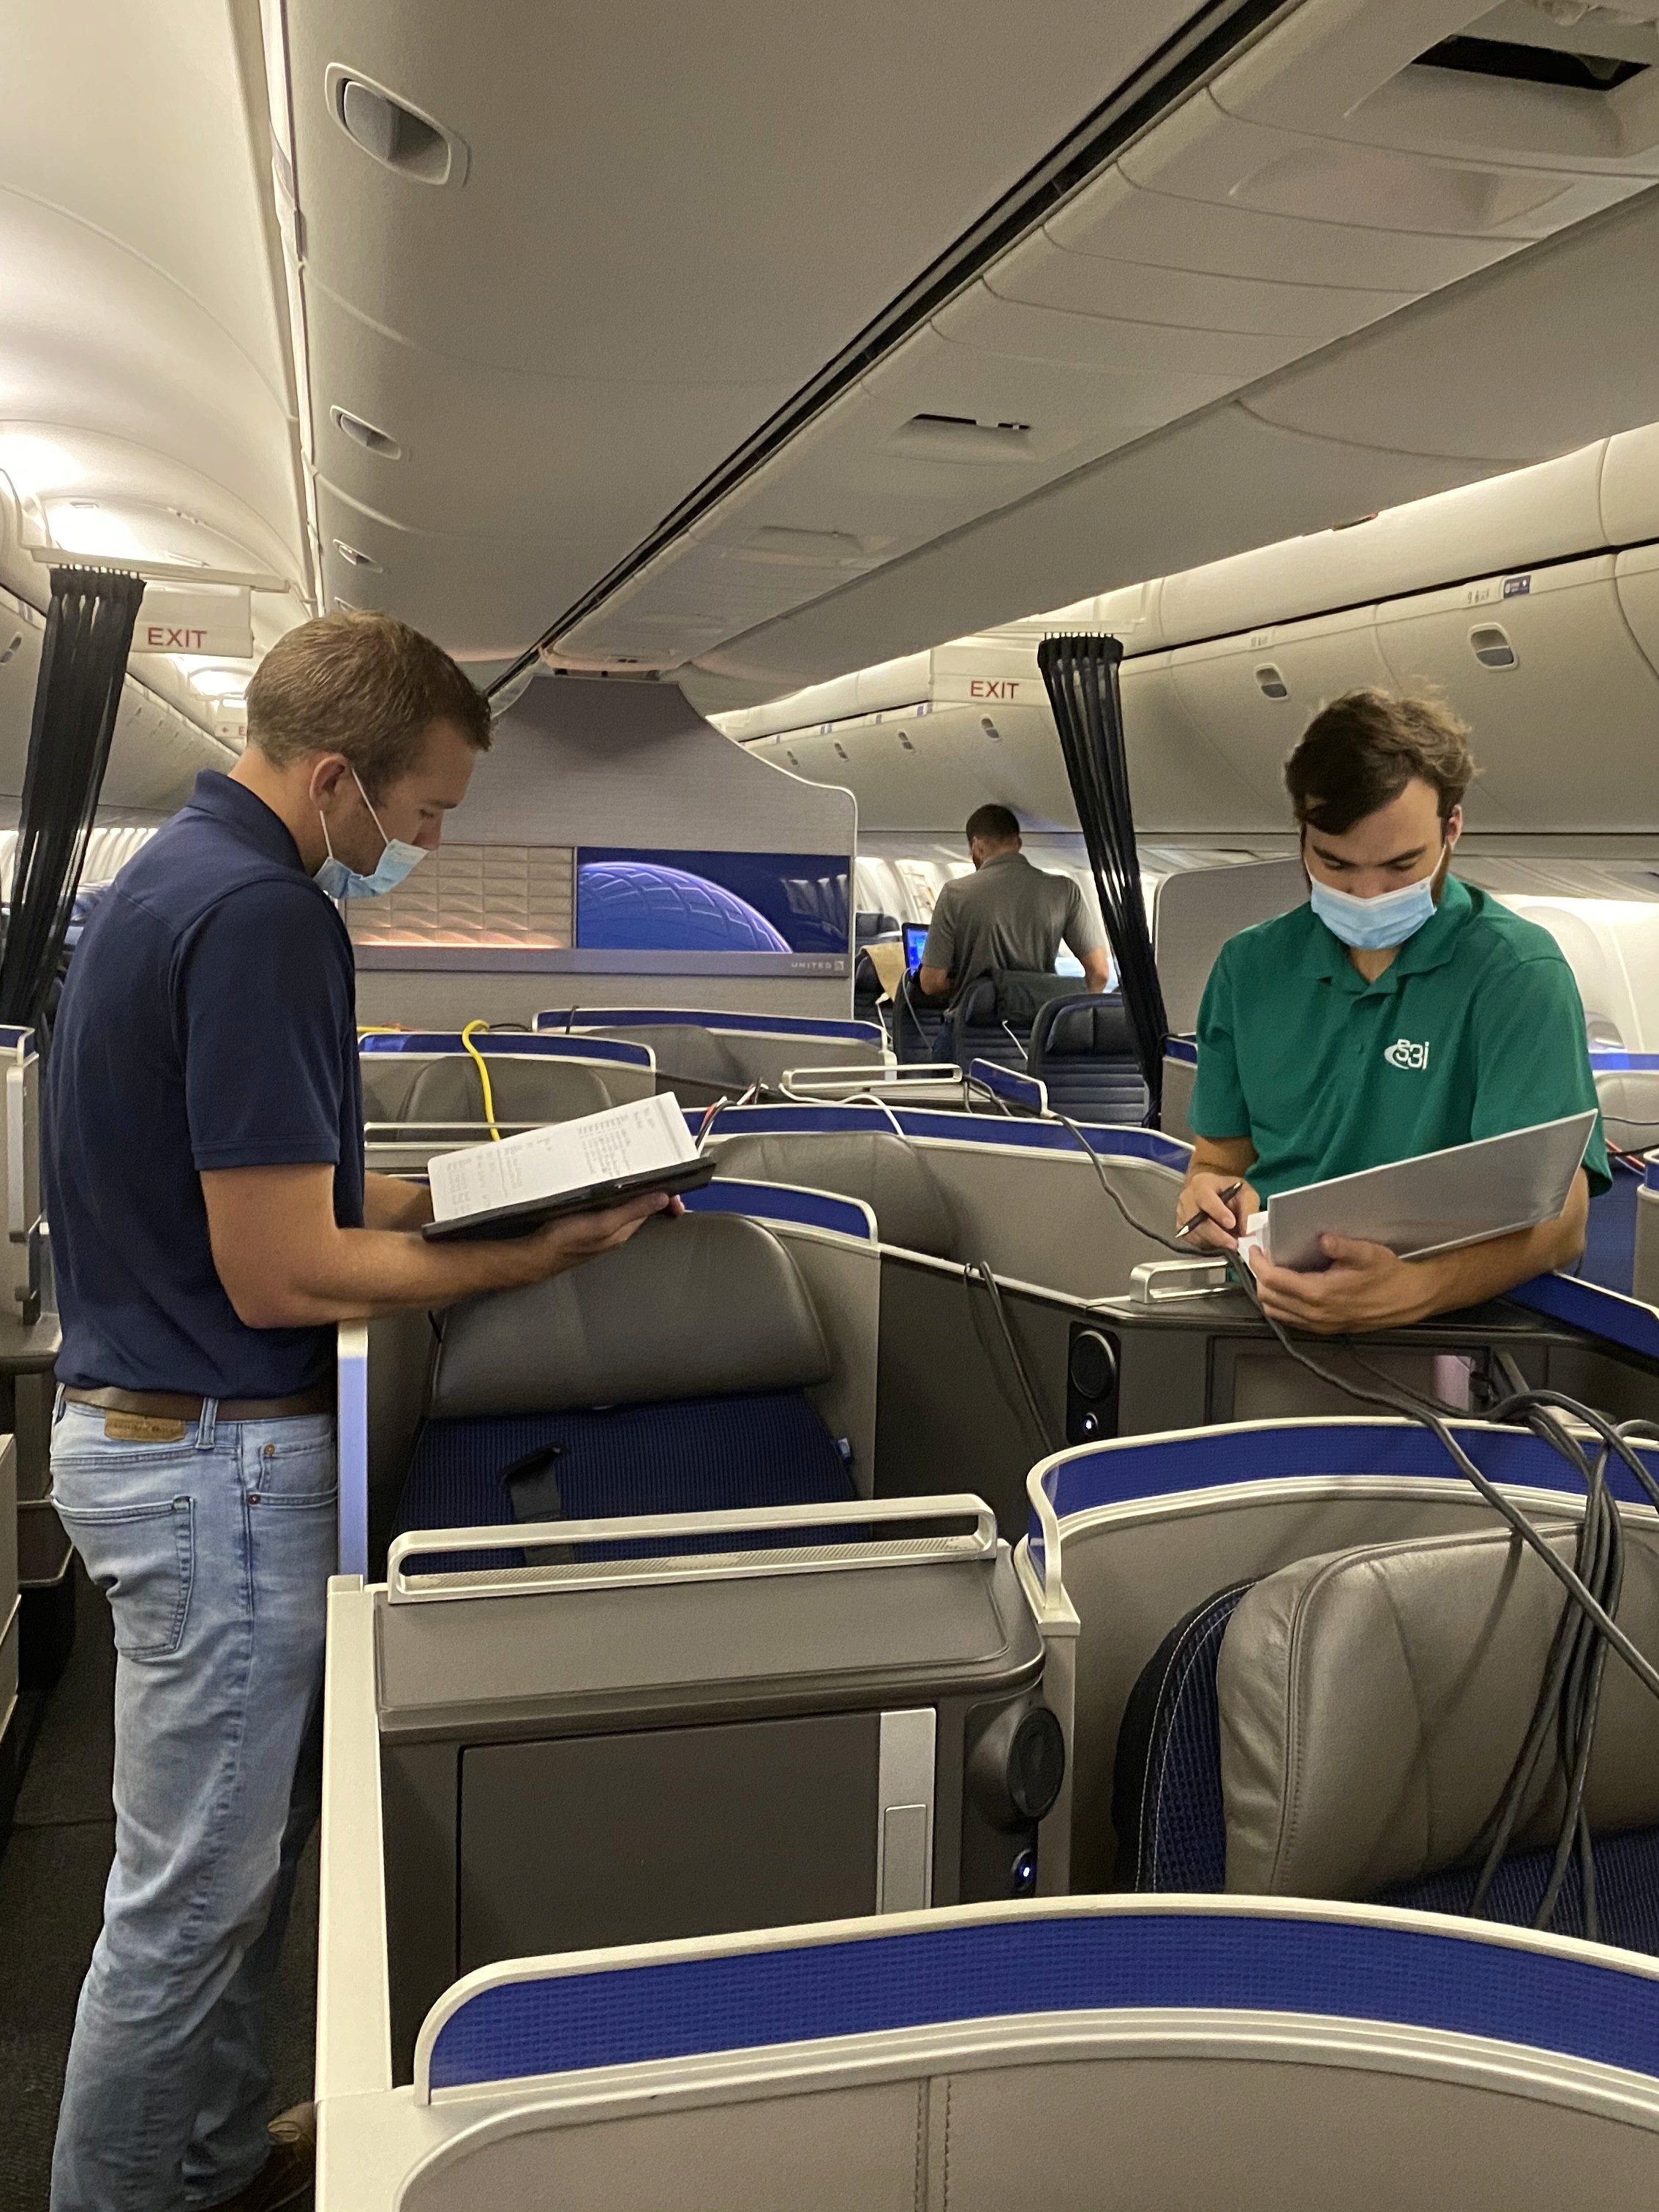
Our testing began with a comprehensive setup to simulate the in-flight environment and data monitoring context. The team utilized two United Airlines planes and 42 S3i aerosol detection sensors. A mannequin was placed on board to simulate a passenger emitting aerosols, replicating a potential Covid-positive individual. This setup created a realistic and controlled scenario for testing the effectiveness of the sensors and the usability of the software interface.
User Testing Participants
Our primary participants were pilots who would potentially use the interface during actual flights. This demographic was specifically selected due to their critical role in interpreting the data for in-flight safety decisions.
Testing Methodology
I facilitated qualitative, moderated usability testing over eight days. This approach provided an in-depth understanding of the pilots’ real-time responses, perceptions, and pain points. Each pilot underwent one-on-one moderated sessions, allowing us to capture qualitative feedback on the initial design and observe specific interactions with the interface.
UX Research Process
Day 1–4: Testing the Original Interface
During the first four days, I tested the initial design with two different pilots each day. Key observations included:
High Cognitive Load: Pilots often struggled to interpret complex data visualizations within the limited time available.
Confusing Icons and Labels: Certain interface elements, including color-coded indicators, did not intuitively communicate the level of risk, causing delays in decision-making.
Lack of Hierarchy: Critical information was not prioritized, making it challenging to identify pressing issues during testing.
These insights guided the development of a streamlined prototype for the second half of the testing.
Design Decisions for the Updated Prototype
Based on observed pain points, I rapidly prototyped an updated interface to be tested during days 5–8. Key design changes included:
Simplified Data Visualization: Data was restructured to reduce cognitive load. Clear, concise visualizations provided immediate insights without extensive interpretation.
Enhanced Color Scheme and Indicators: Risk levels were communicated with intuitive colors and icons, helping pilots make quick, informed decisions.
Information Hierarchy: The interface was redesigned to prominently display critical alerts, followed by secondary information, aligning with pilots' workflow priorities.
Day 5–8: Testing the Redesigned Prototype
For the last four days, I conducted usability testing with two different pilots each day, gathering feedback on the improved prototype. The updated interface demonstrated a clear improvement in usability, as reflected in the following outcomes:
Faster Interpretation: Pilots could now recognize aerosol alerts more quickly, thanks to simplified data presentation.
Reduced Confusion: The clarified iconography and color coding significantly reduced instances of hesitation.
Enhanced Workflow Alignment: The information hierarchy matched the pilots’ needs, enabling them to prioritize responses effectively.
Final Design
The final prototype, based on insights from the second round of testing, provided an intuitive, accessible solution for in-flight aerosol monitoring:
High-Contrast Alerts: Color-coded alerts with clear, bold text conveyed risk levels instantaneously.
Clean, Minimal Interface: Unnecessary elements were removed to create a streamlined display, ensuring that critical information was easy to locate.
Pilot-Focused Flow: The design supported a logical workflow, allowing for quick toggling between essential data views.
Impact
Although the project was not deployed, usability testing provided valuable insights, showing significant improvements in pilots’ ability to interpret aerosol data efficiently. These findings contributed to S3i's design team and will likely impact further iterations.
Metrics (Based on Qualitative Data)
Decision-making Speed Increase: Estimated 30% improvement in time to recognize and act on alerts.
User Satisfaction Score: Increased by 40%, reflecting positive pilot feedback on usability.
Learnings and Future Considerations
Key Takeaways:
Rapid Iteration Benefits: The process highlighted the impact of rapid prototyping and iterative testing in resolving usability issues under a strict timeline.
Value of Realistic Testing Environments: Conducting testing in a simulated cockpit allowed for contextually relevant insights that significantly shaped the redesign.
Importance of Intuitive Visual Cues: Simplifying data visualizations and using intuitive iconography directly improved user comprehension, especially under stress.
Future Opportunities:
Scalability for Different Aircraft: Future testing could explore how the interface adapts to different aircraft systems and displays.
Additional User Roles: Expanding testing to include flight attendants and ground crew could enhance the system’s utility beyond pilots, supporting a holistic in-flight safety network.

